
Date
March 2022
Author
Leesman Insights
Share

March 2022
Leesman Insights


It is the 1830’s. Early Victorian London is seeing a population explosion, doubling in size in 20-years and now fast approaching 1.5-million residents.
But as the largest city in the world its ever-growing population is spilling into overcrowded, decaying, stinking slums and the poorest are literally surrounded by their own filth. Piled in courtyards or overflowing from basement cesspits, raw sewage is everywhere.
Disease is inevitable. Typhoid, Influenza, Tuberculosis, Smallpox and Scarlet Fever are rife. But it was Victorian London’s experience of cholera in 1832 that would have the greatest social impact.
First detected in the slums of Jessore in India, cholera is spread by the bacteria-laced diarrhoea of its victims, and it’s violent and rapid assault on the human body was beyond the understanding of the physicians of the time.
It eventually arrived in England from Baltic ships docking in the Northern port of Sunderland. After the first death there on 26 October 1831, the epidemic spread to neighbouring Newcastle and then northwest to Scotland. The disease soon reached London, carried on colliers’ ships bringing coal south to the capital.
Ten years later, under pressure from London’s elite worried for their own health, leading social reformer Edwin Chadwick was commissioned to conduct an inquiry into the state of public sanitation. His 1842 report, “The Sanitary Conditions of the Labouring Population,” made a clear connection between disease and living conditions and demanded urgent action.
By 1848, Chadwick had been appointed to the first Board of Health and was Sanitary Commissioner of London. He now had the power to change things.
But his actions were firmly guided by the “miasma theory” of disease – that foul air was the route of much disease. But this did at least advocate the rapid removal of human waste through improvements to the sewage and drainage systems.
Unfortunately, this led to a greater flow of raw sewage into the River Thames – the main source of drinking water for Londoners, further contaminating London’s water supply and dramatically increasing the risk of cholera.
It was 1854 before research by physician John Snow, a leader in the adoption of anaesthesia and medical hygiene, would inspire the fundamental changes in the water and waste systems of London required, leading to similar changes in other cities, and a significant improvement in general public health around the world.
Unlike most of his contemporaries, Snow was no “miasmatist” – he publicly stated in 1849 that cholera was transmitted through water.
He was already researching links between water supply and deaths from cholera when the disease returned to the heart of London’s Soho on 31st August 1854.
Over the next three days, 127 people on or near Broad Street died. In the next week, three quarters of the residents had fled the area. By 10 September, 500 people had died and the mortality rate was 12.8 percent in some parts of the city. By the end of the outbreak, 616 people had died.
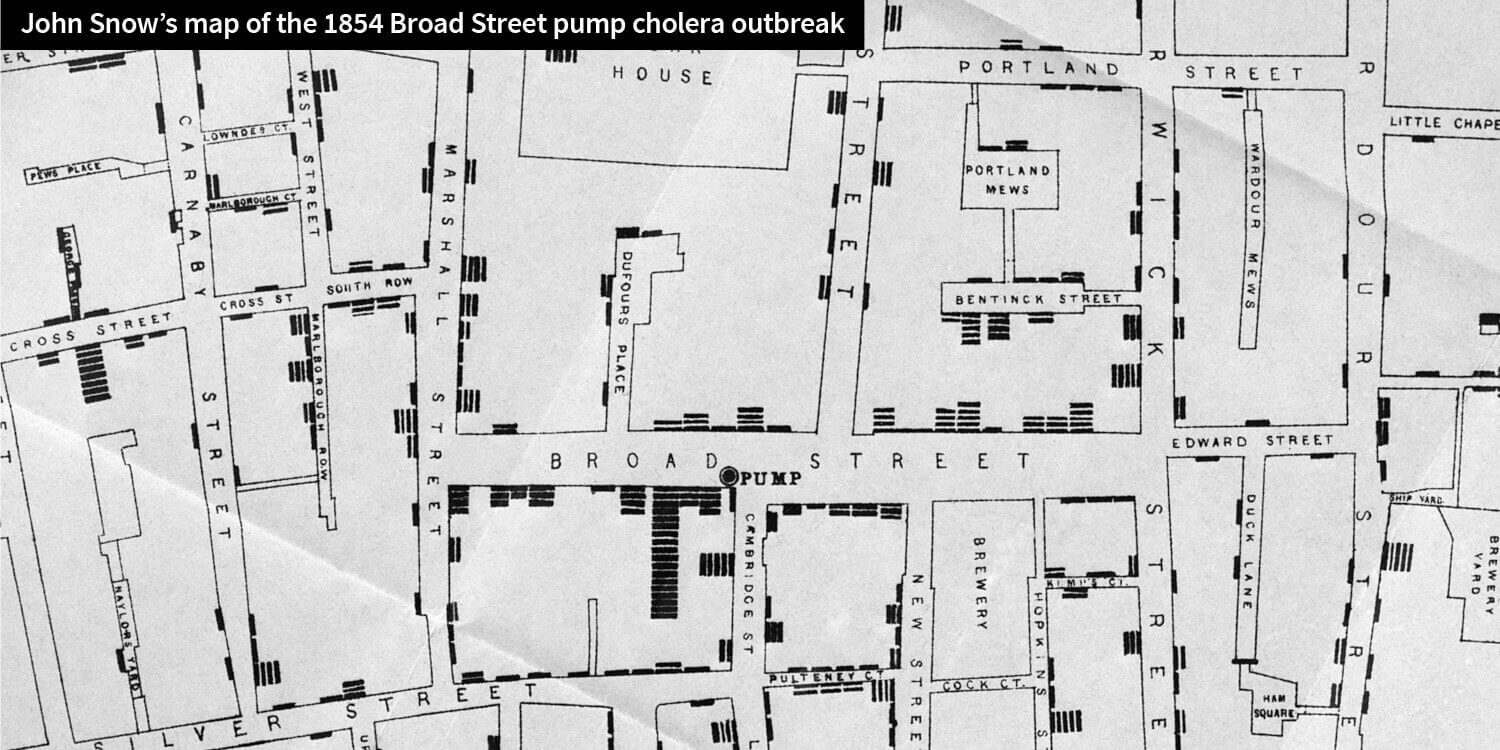
London’s population was now approaching 2.4-million, but Snow managed to trace the outbreak to a single water pump in Soho’s Broad Street. Hundreds of local people were rapidly poisoned after visiting the well, eating or drinking products made using its waters. Snow’s now famous Soho “cholera map,” visually represented the spatial clustering of the deaths with stacked bar-charts attached to the property in which the deaths occurred and provided him the evidence to link the deaths to the single water source.
The outbreak provided Snow with the epidemiological ammunition to confirm his theory, but provides us with one of the best early examples of information graphics used to chart complex data.
When begrudging public officials agreed to have the pump handle removed and the infections ceased almost immediately, Victorian London started to pay attention. The outbreak provided Snow with the epidemiological ammunition to confirm his theory, but provides us with one of the best early examples of information graphics used to chart complex data.
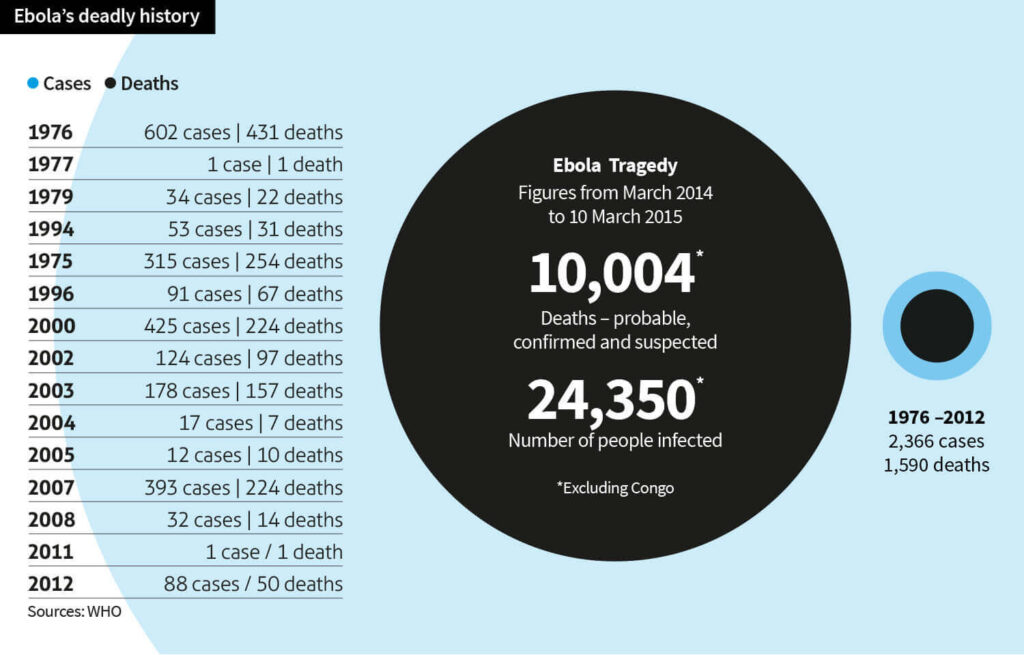
Fast forward 160 years and the contemporary world is gripped with a similar fear for the new super killer Ebola. From 1976, when it was first identified, through to the start of 2013, the World Health Organization reported a total of 1,716 cases.
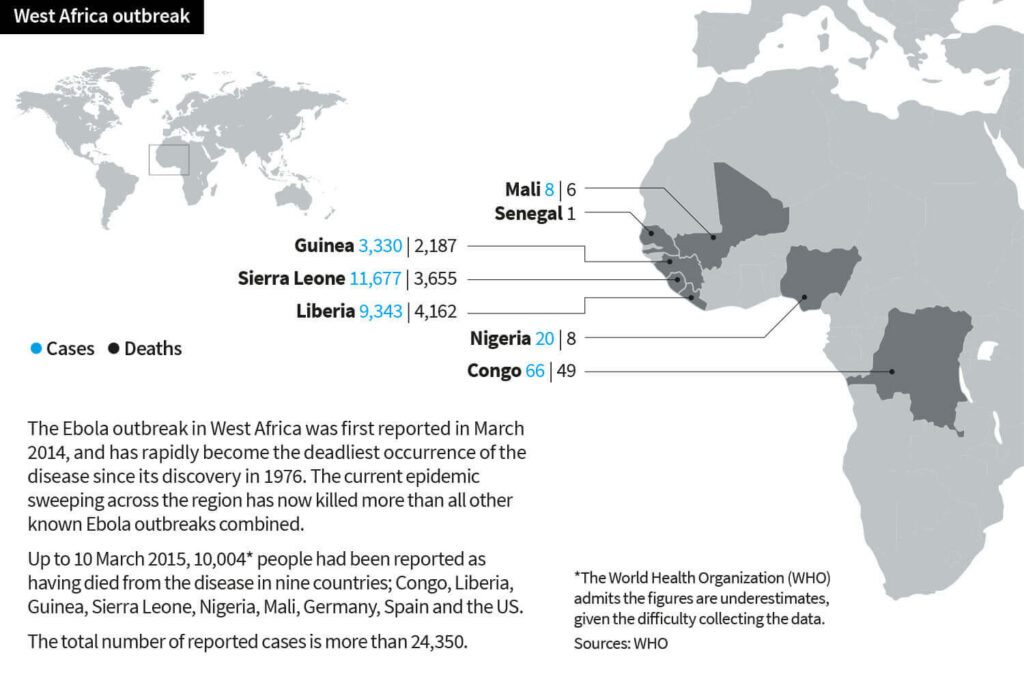
But in March 2014, the WHO were reporting a major Ebola outbreak in Guinea, West Africa. Researchers traced the outbreak to a two-year old child who died on 28 December 2013 but the disease rapidly spread to the neighbouring countries of Liberia and Sierra Leone. It is the largest Ebola outbreak ever documented.
By 8 August 2014, the WHO declared the epidemic an international public health emergency stating “Countries affected to date simply do not have the capacity to manage an outbreak of this size and complexity on their own. I urge the international community to provide this support on the most urgent basis possible.”
By mid-August, Médecins Sans Frontières reported the situation from Liberia’s capital Monrovia as “catastrophic” and “deteriorating daily,” reporting that fears of Ebola among staff members and patients had shut down much of the city’s health system.
Days later and the disease had spread to Nigeria and claimed its first Nigerian victim – Dr. Stella Ameyo Adadevoh, a consultant at the First Consultant Hospital, just over three weeks after she treated Patrick Sawyer, a Liberian Ministry of Finance official, Nigeria’s “Ebola patient zero,” when he arrived sick in Lagos.
But Dr. Adadevoh’s prompt actions and enforced isolation of Sawyer, and the actions of officials that followed, is now recognized as having stopped Ebola in its tracks and saving Nigeria from a fate of the proportion of those now swamping neighbouring nations.
Nigeria’s capital Lagos, with 21 million residents is Africa’s largest city, and like 1830’s Victorian London, characterised by a large population living in crowded and unsanitary slums. Yet the nightmare scenario of a fast-moving, out-of-control Ebola outbreak in a city with extensive transportation ties to the industrialised world never happened.
Amid near hysteria globally and desperate scenes in the three neighbouring west African states struggling against an exponential rise in infection, Nigeria’s success in limiting and then quashing an outbreak is one rare positive piece of Ebola news. But how did a country better known for its corruption do it?
Simply with data and mapping. They came up with a plan, had a fast response and did the legwork on the ground. They mobilised an existing health surveillance system for Polio for contact tracing and used it to trace and isolate Sawyer’s primary and secondary contacts quickly. They hit the streets and spoke to them all.
Mobile technology meant live updates could be made to databases and in a throwback to Snow’s work in Victorian London, visually focus attention on the primary sources of risk.
This led to a chain of events in which 894 contacts were identified and followed for Ebola symptoms, amounting to a total of approximately 18,500 in-person interviews in Lagos, Port Harcourt, and other parts of Nigeria. Each was observed, temperatures taken, data recorded, analysed and tracked.
The U.S. Centers for Disease Control and Prevention, which was involved in managing the outbreak, said Nigerian officials and volunteers had eventually reached more than 26,000 households.
Rui Gama Vaz, World Health Organisation director for Nigeria, called the containment of Ebola in the most populous country in Africa a “spectacular success story.” By 20th October, they announced Nigeria was Ebola free. According to a report from the Centers for Disease Control and Prevention; “It (Nigeria) was effective in identifying all suspected cases and keeping watch on them before they developed symptoms and infect other people. We were able to remove people from communities once they showed symptoms and infect many others,” he said.
Other authorities have also been quick to add praise; Samuel Matoka, for the International Federation of Red Cross and Red Crescent Societies (IFRC).
“Nigeria was not really prepared for the outbreak, but the swift response from the federal government, state governments (and) international organisations … was essential.”
Swift, accurate and effective clinical action was clearly the basis for these successes. But mapping and visualizing data was also central to the outcome. So volunteers are now helping build detailed maps of Western Africa for relief workers through OpenStreetMap (OSM), commonly referred to as the ‘Wikipedia for maps,’ a crowd sourced-mapping project.
Since March this year the team working on West Africa has mapped a staggering 8,000,000 objects – individual buildings, roads, rivers, fields, landmarks and more. Since Ebola is spread by touch, the main method of containing the outbreak is contact tracing: Following the steps of an infected person to see with whom else they might have come into contact. Without adequate maps, that job is near impossible.
And now mobile phone data is being overlaid, mapping population movements and predicting how Ebola may spread. Authorities can see where the best places to set up treatment centres would be and what the most effective ways to restrict travel in an attempt to contain the disease would be.
A clinical cure for Ebola remains elusive so vaccines seem the best interim defense – but these are all still in development. The WHO convened a meeting on 24th October with high-ranking government representatives from Ebola-affected countries and development partners, civil society, regulatory agencies, vaccine manufacturers and funding agencies to discuss and agree on how to fast track testing and deployment of vaccines in sufficient numbers to impact the Ebola epidemic.
Results from phase 1 clinical trials of the most advanced vaccines are undergoing efficacy trials in affected countries now with new emergency protocols adapted to capture and feedback immunogenicity results real-time as they become available.
If these early trials prove remotely effective, pharmaceutical companies developing the vaccines have committed to ramp up production capacity for millions of doses to be available in 2015. But there seems little doubt that data visualisation will be key in charting the success and it is hoped, in combatting the threat of Ebola.